Opening Framing: Assume Breach
Firewalls are preventive—they try to stop attacks. But prevention eventually fails. Attackers find ways through, around, or under defenses. This is why detection is equally important.
Intrusion Detection Systems (IDS) monitor network traffic and system activity for signs of malicious behavior. They're your early warning system—alerting you when something suspicious happens so you can investigate and respond.
This week covers IDS technologies, signature vs. behavioral detection, network monitoring strategies, and how to analyze and test firewall effectiveness.
Key insight: The question isn't "will we be breached?" but "how quickly will we detect it?" Organizations with strong detection capabilities limit damage; those without discover breaches months later.
1) IDS Fundamentals
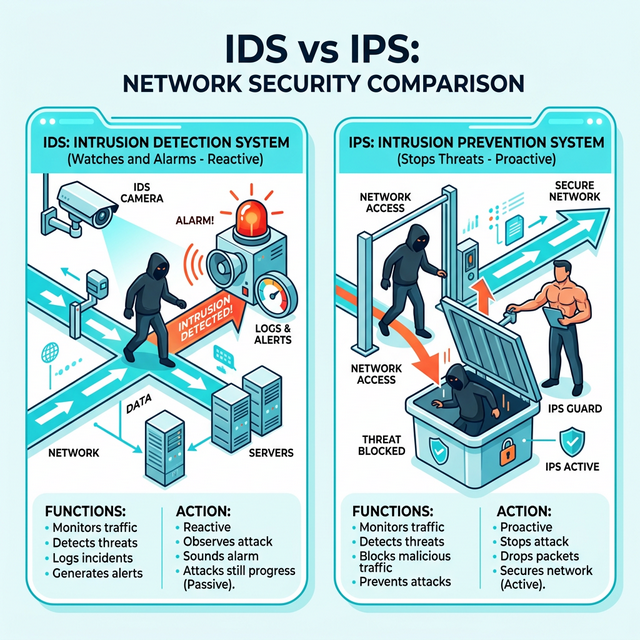
IDS vs. IPS:
IDS (Intrusion Detection System):
- Passive monitoring
- Alerts on suspicious activity
- Doesn't block traffic
- Out-of-band deployment (mirror port)

IPS (Intrusion Prevention System):
- Active blocking
- Alerts AND blocks threats
- Inline deployment (traffic passes through)
- Risk: false positives block legitimate traffic

     IDS Deployment:              IPS Deployment:

     Traffic ──────> Switch       Traffic ──> IPS ──> Destination
                        │                     │
                        └──> IDS              └──> Alert/Block
                             │
                             └──> Alert
Types of IDS:
Network IDS (NIDS):
- Monitors network traffic
- Deployed at network chokepoints
- Sees traffic between systems
- Examples: Snort, Suricata, Zeek

Host IDS (HIDS):
- Monitors individual host activity
- File integrity, process activity, logs
- Sees what happens ON the system
- Examples: OSSEC, Wazuh, Tripwire

Hybrid approaches:
- NIDS + HIDS together
- Network Detection and Response (NDR)
- Endpoint Detection and Response (EDR)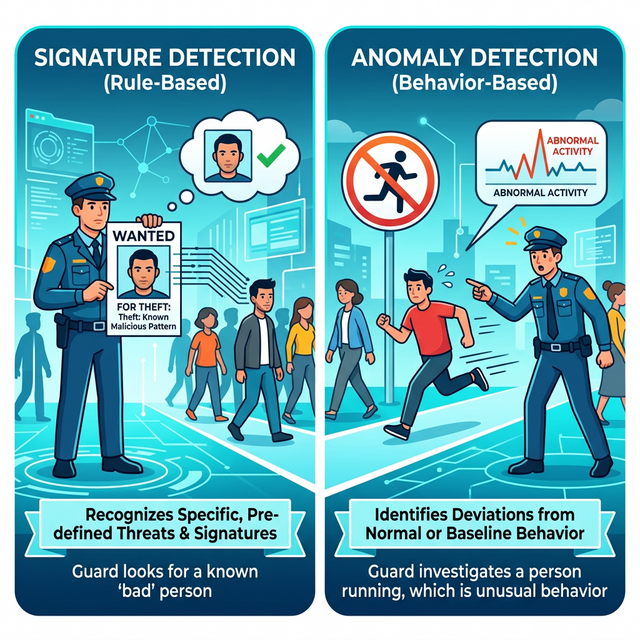
Detection Methods:
Signature-based:
- Matches known attack patterns
- Fast, low false positives for known threats
- Blind to new/unknown attacks
- Like antivirus signatures

Anomaly-based:
- Learns "normal" behavior
- Alerts on deviations
- Can detect unknown attacks
- Higher false positive rate
- Requires tuning period

Behavioral:
- Watches for suspicious actions
- Regardless of specific technique
- Example: "large data transfer at 3 AM"
- Combines signatures + anomaly
Key insight: Signature detection catches known attacks quickly. Anomaly detection catches unknown attacks eventually. Both are needed.
2) Snort and Suricata: Network IDS
Snort Overview:
Snort: Open-source NIDS/IPS
- Created 1998, industry standard
- Signature-based detection
- Community and commercial rulesets
- Can run as IDS or IPS

Modes:
- Sniffer: Display packets (like tcpdump)
- Packet Logger: Log packets to disk
- NIDS: Detect based on rules
- Inline/IPS: Detect and block
Snort Rule Structure:
alert tcp $EXTERNAL_NET any -> $HOME_NET 22 \
(msg:"SSH Brute Force Attempt"; \
flow:to_server,established; \
content:"SSH"; \
threshold:type threshold, track by_src, count 5, seconds 60; \
sid:1000001; rev:1;)

Components:
- Action: alert, log, pass, drop, reject
- Protocol: tcp, udp, icmp, ip
- Source/Dest: IP and port
- Direction: -> (to), <> (bidirectional)
- Options: detection criteria

Common options:
- msg: Alert message
- content: Pattern to match
- pcre: Regex pattern
- flow: Connection state
- threshold: Rate limiting
- sid: Signature ID
- rev: Revision number
Suricata:
Suricata: Modern alternative to Snort
- Multi-threaded (better performance)
- Compatible with Snort rules
- Additional features:
  - File extraction
  - TLS/SSL inspection
  - HTTP logging
  - Lua scripting

# Run Suricata
suricata -c /etc/suricata/suricata.yaml -i eth0

# Test with sample pcap
suricata -c /etc/suricata/suricata.yaml -r sample.pcap
Rule Management:
Rule sources:
- Emerging Threats (free community rules)
- Snort VRT (registered/subscription)
- Custom rules for your environment

Rule updates:
# Using suricata-update
suricata-update
suricata-update list-sources
suricata-update enable-source et/open

# Using PulledPork (Snort)
pulledpork.pl -c pulledpork.conf
Key insight: IDS is only as good as its rules. Regular rule updates and custom rules for your environment are essential.
3) Zeek: Network Security Monitor
Zeek (formerly Bro) takes a different approach—it creates detailed logs of network activity rather than just alerting:
Zeek philosophy:
- Generate rich metadata about connections
- Let analysts query and correlate
- More than just signatures

Zeek logs:
conn.log     - All connections
dns.log      - DNS queries/responses
http.log     - HTTP requests
ssl.log      - TLS/SSL connections
files.log    - File transfers
notice.log   - Zeek-generated alerts
weird.log    - Protocol anomalies
Zeek Log Format (conn.log):
#fields ts      uid     id.orig_h  id.orig_p  id.resp_h  id.resp_p  proto
1234567890.123  CHhAvV  10.0.0.5   52431      93.184.216.34  443    tcp

#fields service duration  orig_bytes  resp_bytes  conn_state
-       ssl     2.34      1234        5678        SF

Fields explained:
- ts: Timestamp
- uid: Unique connection ID
- orig_h/p: Source IP/port
- resp_h/p: Destination IP/port
- service: Detected protocol
- duration: Connection length
- bytes: Data transferred
- conn_state: How connection ended
Zeek for Threat Hunting:
# Find long connections (C2 beacons?)
cat conn.log | zeek-cut duration id.orig_h id.resp_h | \
  awk '$1 > 3600'

# Find large uploads (exfiltration?)
cat conn.log | zeek-cut orig_bytes id.orig_h id.resp_h | \
  awk '$1 > 10000000'

# Find DNS queries to suspicious TLDs
cat dns.log | zeek-cut query | grep -E '\.(xyz|top|tk)$'

# Find HTTP to unusual ports
cat http.log | zeek-cut id.resp_p host | awk '$1 != 80 && $1 != 443'
Zeek Scripts:
# Zeek uses scripting for custom detection
# Example: Alert on large DNS responses (tunneling?)

event dns_message(c: connection, is_orig: bool, msg: dns_msg, len: count)
{
    if (len > 512)
        NOTICE([$note=DNS::Large_Response,
                $msg="Large DNS response detected",
                $conn=c]);
}
Key insight: Zeek excels at providing visibility. Its logs feed SIEMs, enable threat hunting, and support forensic investigations.
4) Alert Analysis and Triage
The Alert Overload Problem:
Reality check:
- IDS generates thousands of alerts daily
- Most are false positives or low priority
- Analysts can't investigate everything
- Alert fatigue leads to missed real threats

Solution: Triage and prioritization
Alert Triage Process:
1. Initial Classification:
   - True positive (real threat)
   - False positive (incorrect alert)
   - Benign true positive (real but authorized)

2. Severity Assessment:
   - What asset is affected?
   - What's the potential impact?
   - Is it targeted or opportunistic?

3. Context Gathering:
   - What else is that host doing?
   - Is the source known malicious?
   - What's normal for this environment?

4. Decision:
   - Investigate further
   - Escalate to incident response
   - Tune/suppress the alert
   - Close as false positive
Key Questions for Each Alert:
About the source:
- Is it internal or external?
- Is it a known asset?
- Any reputation data?

About the destination:
- What is this system?
- Is it critical/sensitive?
- Is this connection normal?

About the activity:
- What triggered the alert?
- Is this expected behavior?
- Any correlated alerts?

About timing:
- Business hours or off-hours?
- First time or repeated?
- Any recent changes?
Reducing False Positives:
Tuning strategies:
- Whitelist known good traffic
- Adjust thresholds
- Add context-aware exceptions
- Disable noisy, low-value rules

Example tuning:
# Original rule alerts on all SSH
# Tune to only alert from external
pass tcp $HOME_NET any -> $HOME_NET 22 \
(msg:"Internal SSH - Allowed"; sid:9999999;)
Key insight: Alert quality matters more than quantity. A well-tuned IDS with fewer, actionable alerts beats a noisy system that gets ignored.
5) Network Monitoring Architecture
Visibility Points:
Where to monitor:

Internet Edge:
- See external attacks
- Monitor ingress/egress
- Capture perimeter traffic

Internal Segments:
- See lateral movement
- Monitor east-west traffic
- Critical for post-compromise detection

Data Center:
- Protect crown jewels
- Monitor server communications
- Detect data exfiltration

Cloud:
- VPC flow logs
- Cloud-native monitoring
- API activity logs
Traffic Capture Methods:
Port Mirroring (SPAN):
- Switch copies traffic to monitor port
- Easy to configure
- May drop packets under load
- Good for initial deployment

Network TAP:
- Hardware device that copies traffic
- No packet loss
- More expensive
- Better for production monitoring

Packet Broker:
- Aggregates multiple sources
- Filters and load balances
- Sends to multiple tools
- Enterprise-scale solution
Full Packet Capture vs. Metadata:
Full Packet Capture:
- Store complete packets
- Enables deep forensics
- Massive storage requirements
- Legal/privacy considerations

Metadata Only (NetFlow, Zeek):
- Connection summaries
- Much less storage
- Sufficient for most detection
- May miss payload-based attacks

Hybrid approach:
- Metadata for everything
- Triggered full capture for alerts
- Retain full capture for limited time
Integration with SIEM:
Modern monitoring stack:

Network Traffic ──> IDS/NDR ──> Alerts ──┐
                                         │
Zeek/Flow Logs ──────────────────────────┼──> SIEM ──> Analysts
                                         │
Firewall Logs ───────────────────────────┤
                                         │
Endpoint Logs ───────────────────────────┘

SIEM provides:
- Log aggregation
- Correlation rules
- Alert management
- Case management
- Reporting/compliance
Key insight: Monitoring is an architecture, not a product. Effective detection requires the right sensors, in the right places, feeding the right analysis tools.
Real-World Context: IDS in Security Operations
IDS is central to security operations:
SOC Operations: Security analysts monitor IDS alerts as their primary activity. They triage alerts, investigate suspicious activity, and escalate confirmed threats to incident response.
Threat Hunting: Hunters use IDS logs (especially Zeek) to proactively search for threats. They look for patterns that automated detection misses—subtle anomalies that indicate sophisticated attackers.
Incident Response: During incidents, IDS data provides timeline information. When did the attack start? What systems were accessed? What data may have been exfiltrated?
MITRE ATT&CK Reference:
- DS0029 - Network Traffic: Data source for detection
- T1040 - Network Sniffing: Attackers capturing traffic
- T1562.001 - Disable or Modify Tools: Evading IDS
Key insight: IDS transforms network traffic into security intelligence. Without monitoring, you're flying blind.
Guided Lab: Snort/Suricata Alert Analysis
Let's set up a network IDS and analyze alerts from sample traffic.
Step 1: Install Suricata
# Ubuntu/Debian
sudo apt update
sudo apt install suricata

# Verify installation
suricata --build-info

# Update rules
sudo suricata-update
sudo suricata-update list-sources
sudo suricata-update enable-source et/open
sudo suricata-update
Step 2: Configure Suricata
# Edit configuration
sudo nano /etc/suricata/suricata.yaml

# Key settings to check:
# - HOME_NET: Your network range
# - EXTERNAL_NET: Everything else
# - default-rule-path: Where rules are stored
# - outputs: Enable eve-log (JSON)

# Set HOME_NET (example)
vars:
  address-groups:
    HOME_NET: "[192.168.0.0/16,10.0.0.0/8]"
    EXTERNAL_NET: "!$HOME_NET"
Step 3: Test with Sample PCAP
# Download sample malicious PCAP
# (Use samples from malware-traffic-analysis.net)
wget [sample-pcap-url] -O test.pcap

# Run Suricata against PCAP
sudo suricata -c /etc/suricata/suricata.yaml -r test.pcap -l ./logs

# Check for alerts
cat ./logs/fast.log
cat ./logs/eve.json | jq 'select(.event_type=="alert")'
Step 4: Analyze Alerts
# View alert summary
cat ./logs/fast.log

# Example output:
# 01/15/2024-10:23:45.123456 [**] [1:2024792:3] ET MALWARE
# Possible Malicious Macro DL [**] [Classification: A Network
# Trojan was detected] [Priority: 1] {TCP} 10.0.0.5:52431 ->
# 93.184.216.34:80

# Parse JSON alerts
cat ./logs/eve.json | jq 'select(.event_type=="alert")' | \
  jq '{timestamp, src_ip, dest_ip, alert: .alert.signature}'
Step 5: Investigate an Alert
# For each alert, gather context:

# 1. What rule triggered?
grep "sid:2024792" /var/lib/suricata/rules/*.rules

# 2. What traffic caused it?
# Open original PCAP in Wireshark
# Filter to the source/dest from alert

# 3. Is it a true positive?
# Research the signature
# Check threat intel on IPs/domains
Step 6: Write a Custom Rule
# Create custom rule file
sudo nano /etc/suricata/rules/local.rules

# Example: Alert on connections to suspicious port
alert tcp $HOME_NET any -> $EXTERNAL_NET 4444 \
(msg:"SUSPICIOUS Outbound connection to port 4444"; \
flow:to_server,established; \
classtype:trojan-activity; \
sid:9000001; rev:1;)

# Include in suricata.yaml and reload
sudo suricatasc -c reload-rules
Step 7: Reflection (mandatory)
- What types of threats did the sample PCAP contain?
- How would you determine if an alert is a true or false positive?
- What additional context would help you investigate alerts?
- Why is rule tuning important for operational IDS?
Week 12 Outcome Check
By the end of this week, you should be able to:
- Explain the difference between IDS and IPS
- Describe signature vs. anomaly-based detection
- Read and write basic Snort/Suricata rules
- Analyze IDS alerts and determine true/false positives
- Understand Zeek logs for network visibility
- Design a network monitoring architecture
Next week: Capstone Project—putting everything together in a comprehensive network security assessment.
🎯 Hands-On Labs (Free & Essential)
Practice alert analysis and detection workflows before moving to reading resources.
🎮 TryHackMe: Intro to SOC
What you'll do: Walk through SOC workflows, alert triage, and basic monitoring
concepts.
Why it matters: IDS alerts must be triaged quickly to reduce dwell time.
Time estimate: 1-1.5 hours
📝 Lab Exercise: Alert Triage Worksheet
Task: Review three sample IDS alerts and classify them as true positive, false
positive, or needs investigation.
Deliverable: Triage notes with one recommended next step per alert.
Why it matters: Detection is useless without fast, consistent triage.
Time estimate: 45-60 minutes
🏁 PicoCTF Practice: Forensics (Network Artifacts)
What you'll do: Analyze basic artifacts and identify suspicious patterns in provided
data.
Why it matters: IDS alerts usually point to artifacts you must validate.
Time estimate: 1-2 hours
💡 Lab Tip: Prioritize alerts with external source IPs, credential access, or large data transfers.
Resources
Complete the required resources to build your foundation.
- Suricata Documentation · 60-90 min · 50 XP · Resource ID: csy104_w12_r1 (Required)
- Zeek Quick Start Guide · 45-60 min · 50 XP · Resource ID: csy104_w12_r2 (Required)
- Snort Documentation · Reference · 25 XP · Resource ID: csy104_w12_r3 (Optional)
Lab: IDS Deployment and Analysis
Goal: Deploy an IDS, analyze real traffic, and produce an alert analysis report.
Part 1: IDS Setup
- Install Suricata on a Linux VM
- Configure HOME_NET for your environment
- Enable Emerging Threats ruleset
- Verify Suricata is running and logging
Part 2: Traffic Analysis
- Download 3 sample PCAPs from malware-traffic-analysis.net
- Run each through Suricata
- For each PCAP, document:
- Number of alerts generated
- Alert categories (malware, exploit, policy, etc.)
- Source and destination IPs
Part 3: Deep Dive Investigation
- Select one high-severity alert from your analysis
- Investigate thoroughly:
- What rule triggered? Why?
- What was the actual traffic? (Wireshark)
- Is this a true positive?
- What threat does this represent?
- What would be the recommended response?
Part 4: Custom Rule
- Write a custom Suricata rule for a specific threat
- Test it against sample traffic
- Document the rule and its purpose
Deliverable (submit):
- Suricata configuration (sanitized)
- Alert summary for each PCAP analyzed
- Deep dive investigation report (1-2 pages)
- Custom rule with explanation
- One paragraph: What makes an effective IDS deployment?
Checkpoint Questions
- What is the difference between IDS and IPS?
- What is the difference between signature and anomaly detection?
- What are the main components of a Snort/Suricata rule?
- What is Zeek and how does it differ from Snort?
- How do you determine if an IDS alert is a false positive?
- Why is network visibility important for security?
Weekly Reflection
Reflection Prompt (200-300 words):
This week you learned about intrusion detection—the security control that watches for threats that bypass prevention. You configured an IDS, analyzed alerts, and investigated suspicious activity.
Reflect on these questions:
- IDS generates many alerts, most of which are false positives. How does this affect security operations? What can be done?
- Consider the trade-off between detection sensitivity and alert volume. How would you optimize for your organization?
- Signature-based detection misses new attacks; anomaly-based generates more false positives. How would you balance both?
- How has working with IDS changed your understanding of network security monitoring?
A strong reflection will consider the operational challenges of running an effective IDS program.
Verified Resources & Videos
- Sample PCAPs: Malware Traffic Analysis
- Emerging Threats Rules: Emerging Threats Ruleset
- MITRE ATT&CK: Network Traffic Data Source
Intrusion detection is the foundation of security monitoring. The skills you've learned—analyzing alerts, investigating threats, writing rules—are core SOC analyst competencies. Next week: your capstone brings everything together.